

In Battlefield 6, the FX-6300 is slightly slower than the Ryzen 5 1400. However, it's a better value for money, as it's $19 cheaper!
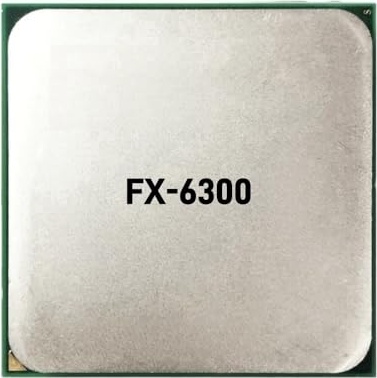
FX-6300
- Up to 32% cheaper – $40.65 vs $59.99
- Up to 32% cheaper
- Up to 26% better value in Battlefield 6 – $0.66 vs $0.89/FPS
- Up to 26% better value in Battlefield 6
- Can run games without a dedicated GPU using its integrated graphics
- Can run games without a dedicated GPU using its integrated graphics
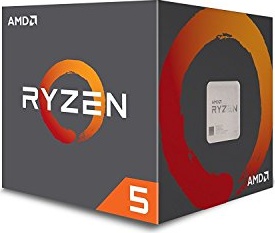
Ryzen 5 1400
- Up to 10% faster in Battlefield 6 – 67 vs 61 FPS
- Up to 10% faster in Battlefield 6
- Is 4 years and 5 months newer – Apr 11, 2017 vs Oct 23, 2012
- Is 4 years and 5 months newer
- Consumes up to 32% less energy – 65 vs 95 Watts
- Consumes up to 32% less energy
Battlefield 6 FPS Calculator
FX-6300 vs Ryzen 5 1400: Comparison of performance and price
FX-6300
Oct 23rd, 2012
Average FPS
61 FPS
91%
Min 1% FPS
46 FPS
92%
Price, $
$40.65
100%
Value, $/FPS
$0.66/FPS
100%
Ryzen 5 1400
Apr 11th, 2017
Average FPS
67 FPS
100%
Min 1% FPS
50 FPS
100%
Price, $
$59.99
67%
Value, $/FPS
$0.89/FPS
74%
Synthetic Benchmarks
The FX-6300 vs Ryzen 5 1400 in synthetic CPU benchmarks
Performance Specifications
The FX-6300 vs Ryzen 5 1400 in core CPU performance specifications
FX-6300
Oct 23rd, 2012
Cores
6-core
100%
L3 Cache
8 MB
100%
Base Frequency
3.5 GHz
100%
Turbo Frequency
4.1 GHz
100%
Max. DDR3 RAM Speed
1866 MHz
70%
Ryzen 5 1400
Apr 11th, 2017
Cores
4-core
67%
L3 Cache
8 MB
100%
Base Frequency
3.2 GHz
91%
Turbo Frequency
3.4 GHz
83%
Max. DDR4 RAM Speed
2666 MHz
100%
Specifications
Comparison of core specifications
FX-6300 Oct 23rd, 2012 | SpecificationsComparison of core specifications | Ryzen 5 1400 Apr 11th, 2017 |
|---|---|---|
| General | ||
| Oct 23rd, 2012 | Release Date | Apr 11th, 2017 |
$132.00 | MSRP | $169.00 |
Desktop | Segment | Desktop |
| AM3+ | Socket | AM4 |
| 95W | Power Consumption | 65W |
| Other Features | ||
| 1866 MHz (DDR3) | RAM | 2666 MHz (DDR4) |
On certain motherboards (Chipset feature) | Integrated GPU | No Integrated Graphics |
| Overclockable | Overclock Support | Overclockable |