


Key Differences
In short — Skytech Siege outperforms SYSTEMTREFF on the selected game parameters. We do not have the prices of both PC Builds to compare value.
Advantages of Skytech Gaming Siege Gaming PC
- Performs up to 48% better in Call of Duty: Modern Warfare II than SYSTEMTREFF - 151 vs 102 FPS

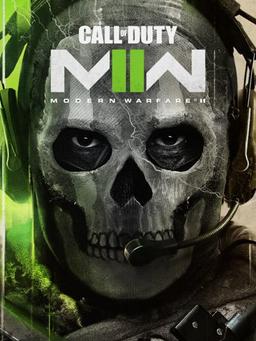
Call of Duty: Modern Warfare II
Resolution
1920 x 1080
Game Graphics
Extreme
Jan 19th, 2023 • 1st Variation
FPS
151
100%
Value, $/FPS
$13.11/FPS
100%
Price, $
$1979.1
100%
FPS and Value Winner
Buy for $1,979.1 on Amazon
In Stock
Updated 154 minutes ago
My Games
With selected game settings
Resolution
1920 x 1080
Game Graphics
Extreme
133rd Variation
Jan 19th, 2023 • 1st Variation


GPU Comparison
Compared by selected game FPS and theoretical performance
133rd Variation


GeForce RTX 4060 Ti 16 GB
16 GB GDDR6 | 128-bit
Pixel Fillrate
121.7 GPixel/s
58%
Texel Fillrate
344.8 GTexel/s
55%
GPU Winner
Jan 19th, 2023 • 1st Variation
GeForce RTX 4070 Ti
12 GB GDDR6X | 192-bit
Pixel Fillrate
208.8 GPixel/s
100%
Texel Fillrate
626.4 GTexel/s
100%
CPU Comparison
Compared by selected game FPS and Geekbench 5 benchmark scores
133rd Variation

Ryzen 7 7700
3.8 GHz | 8-core
Single-Core
2878
100%
Multi-Core
14943
100%
CPU Winner
Jan 19th, 2023 • 1st Variation

Core i7-12700F
2.1 GHz | 12-core
Single-Core
2402
83%
Multi-Core
11831
79%
SYSTEMTREFF Gaming PC | vs | Skytech Gaming Siege Gaming PC |
|---|---|---|
| Unknown | Release Date | Jan 19th, 2023 |
| Ryzen 7 7700 | CPU | Core i7-12700F |
| GeForce RTX 4060 Ti 16 GB | GPU | GeForce RTX 4070 Ti |
32 GB | RAM | 16 GB |
| N/A Storage | Storage | 1 TB SSD |


