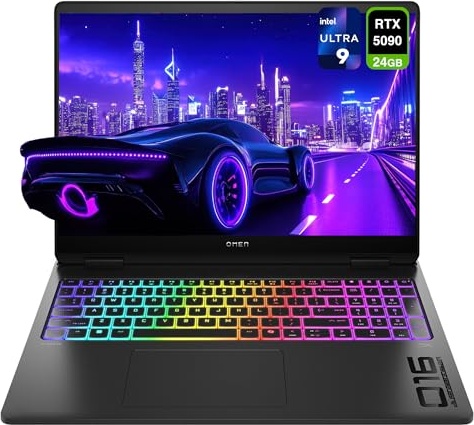
TOP 1 Laptop for$4,000
FPS
| RTX 5090 Mobile#1 | |
| Ultra 9 285HX#3 | |
| 18" QHD 240Hz | |
| 64 GB |
+ View More Specs


Search and filter for gaming laptops. Click on a laptop to view stock, specifications, and calculate the game's FPS performance. Compare laptops in games.
By price segment – the best gaming laptops your money can buy in 2025
TOP 1 Laptop for$4,000
FPS
| RTX 5090 Mobile#1 | |
| Ultra 9 285HX#3 | |
| 18" QHD 240Hz | |
| 64 GB |
+ View More Specs
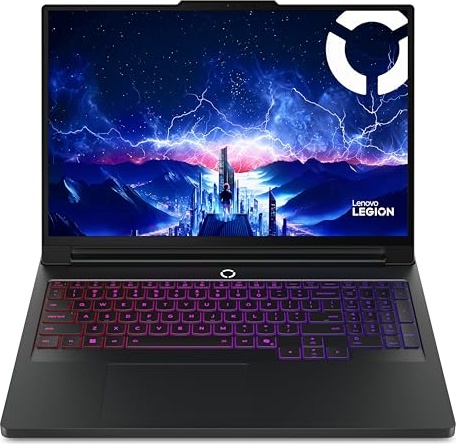
TOP 1 Laptop for$3,500
FPS
| RTX 5090 Mobile#1 | |
| Ultra 9 275HX#5 | |
| 16" WUXGA 165Hz | |
| 16 GB |
+ View More Specs
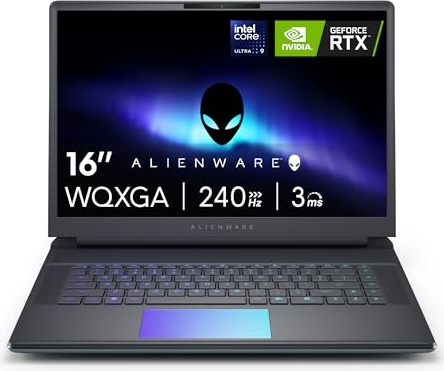
TOP 1 Laptop for$3,250
FPS
| RTX 5090 Mobile#1 | |
| Ultra 9 275HX#5 | |
| 16" 2.5K 240Hz | |
| 32 GB |
+ View More Specs
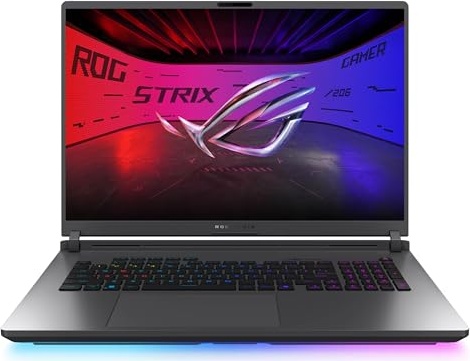
TOP 1 Laptop for$3,000
FPS
| RTX 5080 Mobile#2 | |
| Ultra 9 275HX#5 | |
| 16" 2.5K 240Hz | |
| 64 GB |
+ View More Specs
TOP 1 Laptop for$2,750
FPS
| RTX 5070 Ti Mobile#6 | |
| Ultra 9 275HX#5 | |
| 16" 2.5K 240Hz | |
| 32 GB |
+ View More Specs
TOP 1 Laptop for$2,500
FPS
| RTX 5070 Ti Mobile#6 | |
| Ultra 9 275HX#5 | |
| 16" 2.5K 240Hz | |
| 32 GB |
+ View More Specs
TOP 1 Laptop for$2,250
FPS
| RTX 5070 Mobile#7 | |
| Ultra 9 275HX#5 | |
| 18" 2.5K 240Hz | |
| 32 GB |
+ View More Specs
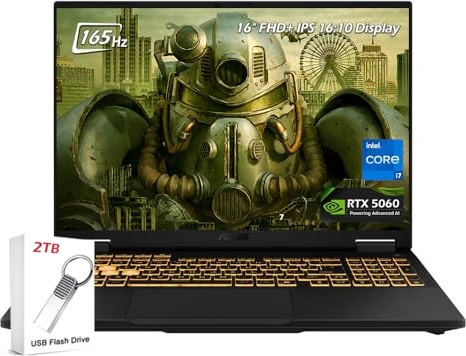
TOP 1 Laptop for$2,000
FPS
| RTX 5060 Mobile#10 | |
| Ultra 9 285#16 | |
| 16" FHD 144Hz | |
| 64 GB |
+ View More Specs
TOP 1 Laptop for$1,750
FPS
| RTX 5060 Mobile#10 | |
| i7-14700#43 | |
| 16" FHD 144Hz | |
| 64 GB |
+ View More Specs
TOP 1 Laptop for$1,500
FPS
| RTX 5060 Mobile#10 | |
| Ultra 9 285#16 | |
| 16" FHD 144Hz | |
| 32 GB |
+ View More Specs
TOP 1 Laptop for$1,250
FPS
| RTX 5050 Mobile#23 | |
| Ultra 5 225#50 | |
| 16" FHD 165Hz | |
| 32 GB |
+ View More Specs
Found 765 Laptops
TOP 1 Laptop for$2,500
FPS
| RTX 5070 Ti Mobile#6 | |
| Ultra 9 275HX#5 | |
| 16" 2.5K 240Hz | |
| 32 GB |
+ View More Specs
FPS
| RTX 5080 Mobile#2 | |
| Ultra 9 275HX#5 | |
| 16" 2.5K 240Hz | |
| 32 GB |
+ View More Specs
FPS
| RTX 5050 Mobile#23 | |
| 7 240H#41 | |
| 16" 2.5K 120Hz | |
| 16 GB |
+ View More Specs
TOP 1 Laptop for$1,750
FPS
| RTX 5060 Mobile#10 | |
| i7-14700#43 | |
| 16" FHD 144Hz | |
| 64 GB |
+ View More Specs
TOP 1 Laptop for$1,500
FPS
| RTX 5060 Mobile#10 | |
| Ultra 9 285#16 | |
| 16" FHD 144Hz | |
| 32 GB |
+ View More Specs
TOP 2 Laptop for$1,750
FPS
| RTX 5070 Mobile#7 | |
| Ultra 9 285#16 | |
| 16" 2.5K 240Hz | |
| 16 GB |
+ View More Specs
FPS
| RTX 5060 Mobile#10 | |
| Ryzen 7 260#34 | |
| 16" WUXGA 180Hz | |
| 32 GB |
+ View More Specs
TOP 2 Laptop for$1,500
FPS
| RTX 5060 Mobile#10 | |
| i7-14650HX#13 | |
| 15.6" QHD 165Hz | |
| 16 GB |
+ View More Specs
FPS
| RTX 4060 Mobile#18 | |
| Ryzen 7 8845HS#32 | |
| 15.6" FHD 144Hz | |
| 64 GB |
+ View More Specs
FPS
| RTX 5070 Mobile#7 | |
| Ryzen 9 8940HX#15 | |
| 16" FHD 144Hz | |
| 64 GB |
+ View More Specs
TOP 1 Laptop for$2,250
FPS
| RTX 5070 Mobile#7 | |
| Ultra 9 275HX#5 | |
| 18" 2.5K 240Hz | |
| 32 GB |
+ View More Specs
TOP 1 Laptop for$2,000
FPS
| RTX 5060 Mobile#10 | |
| Ultra 9 285#16 | |
| 16" FHD 144Hz | |
| 64 GB |
+ View More Specs
TOP 2 Laptop for$2,500
FPS
| RTX 5070 Mobile#7 | |
| Ultra 9 285#16 | |
| 16" 2.5K 240Hz | |
| 64 GB |
+ View More Specs
TOP 3 Laptop for$1,750
FPS
| RTX 5060 Mobile#10 | |
| i7-14700#43 | |
| 16" FHD 144Hz | |
| 32 GB |
+ View More Specs
FPS
| RTX 5070 Mobile#7 | |
| Ultra 9 285#16 | |
| 16" 2.5K 240Hz | |
| 32 GB |
+ View More Specs
FPS
| RTX 5070 Mobile#7 | |
| Ryzen 7 260#34 | |
| 18" 2.5K 240Hz | |
| 64 GB |
+ View More Specs
TOP 2 Laptop for$2,000
FPS
| RTX 5080 Mobile#2 | |
| 7 240H#41 | |
| 16" 2.5K 165Hz | |
| 32 GB |
+ View More Specs
TOP 3 Laptop for$1,500
FPS
| RTX 5060 Mobile#10 | |
| i7-14650HX#13 | |
| 16" FHD 165Hz | |
| 32 GB |
+ View More Specs