In The Last of Us Part II, the GeForce GTX 1050 Ti Max-Q is much slower than the Radeon RX 9070. We cannot compare value as at least one GPU is out of stock.
GeForce GTX 1050 Ti Max-Q
- Consumes up to 66% less energy – 75 vs 220 Watts
- Consumes up to 66% less energy
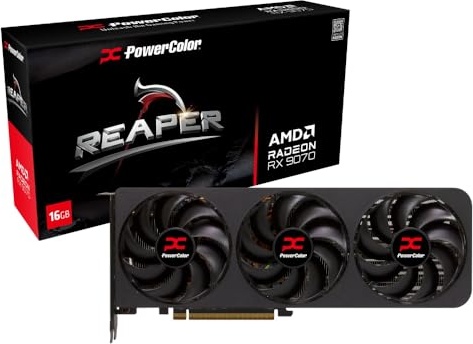
Radeon RX 9070
- Up to 12200% faster in The Last of Us Part II – 123 vs 1 FPS
- Up to 12200% faster in The Last of Us Part II
- Is 7 years and 2 months newer – Mar 06, 2025 vs Jan 03, 2018
- Is 7 years and 2 months newer
- Up to 300% more VRAM memory – 16 vs 4 GB
- Up to 300% more VRAM memory
The Last of Us Part II FPS Calculator
GeForce GTX 1050 Ti Max-Q vs Radeon RX 9070: Comparison of performance and price
All items are out of stock
Radeon RX 9070
Mar 6th, 2025
Average FPS
123 FPS
100%
Min 1% FPS
92 FPS
100%
Price, $
$569.99
100%
Value, $/FPS
$4.63/FPS
100%


Synthetic Benchmarks
GeForce GTX 1050 Ti Max-Q vs Radeon RX 9070: Comparison of synthetic benchmarks
Performance Specifications
GeForce GTX 1050 Ti Max-Q vs Radeon RX 9070: Comparison of core performance specifications
GeForce GTX 1050 Ti Max-Q
Jan 3rd, 2018
Memory
4 GB
25%
Memory Bandwidth
112.1 GB/s
17%
Pixel Fillrate
41.31 GPixel/s
13%
Texture Fillrate
61.97 GTexel/s
11%
FP32
1.983 TFLOPS
5%
Radeon RX 9070
Mar 6th, 2025
Memory
16 GB
100%
Memory Bandwidth
644.6 GB/s
100%
Pixel Fillrate
322.6 GPixel/s
100%
Texture Fillrate
564.5 GTexel/s
100%
FP32
36.13 TFLOPS
100%
Specifications
Comparison of core specifications
GeForce GTX 1050 Ti Max-Q Jan 3rd, 2018 | SpecificationsComparison of core specifications | Radeon RX 9070 Mar 6th, 2025 |
|---|---|---|
| General | ||
| Jan 3rd, 2018 | Released | Mar 6th, 2025 |
| – | MSRP | $549.00 |
| GeForce 10 Mobile | Generation | Navi IV (RX 9000) |
Laptop | Segment | Desktop |
75 W | Power Consumption | 220 W |