CyberPowerPC Gamer Master
$1,099.99
| GPU | GeForce RTX 4060 Ti 8 GB |
| CPU | Ryzen 7 8700F |
| RAM | 16 GB |
+ View More Specs
Search and filter for PC builds. Click on a PC to view full specifications, and calculate the game's FPS performance. Compare PCs in games.
Add a PC Build
Click to Select a PC Build
Add a PC Build
Click to Select a PC Build
Found 18 PCs
CyberPowerPC Gamer Master
$1,099.99
| GPU | GeForce RTX 4060 Ti 8 GB |
| CPU | Ryzen 7 8700F |
| RAM | 16 GB |
+ View More Specs
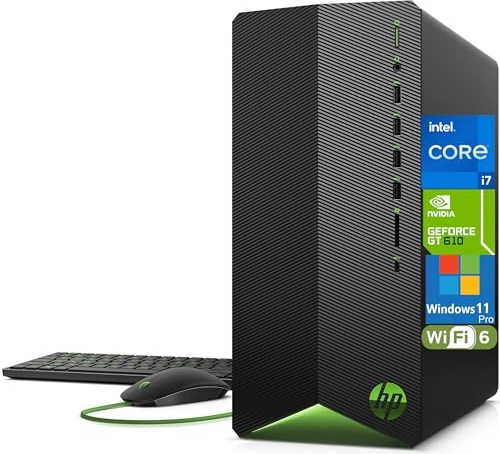
HP Pavilion Tower
$1,399.00
| GPU | GeForce GT 610 |
| CPU | Core i7-11700F |
| RAM | 32 GB |
+ View More Specs
CyberPowerPC Gamer Xtreme VR
$989.99
| GPU | GeForce RTX 4060 |
| CPU | Core i5-13400F |
| RAM | 16 GB |
+ View More Specs
Dell Vostro 3030 3000 Tower Business
$549.00
| GPU | GeForce 210 |
| CPU | Core i5-11500T |
| RAM | 16 GB |
+ View More Specs
Alienware Aurora R16
$2,675.99
| GPU | GeForce RTX 4070 SUPER |
| CPU | Core i7-14700F |
| RAM | 32 GB |
+ View More Specs
Dell XPS 8960
$2,449.98
| GPU | GeForce RTX 4070 |
| CPU | Core i9-14900K |
| RAM | 32 GB |
+ View More Specs
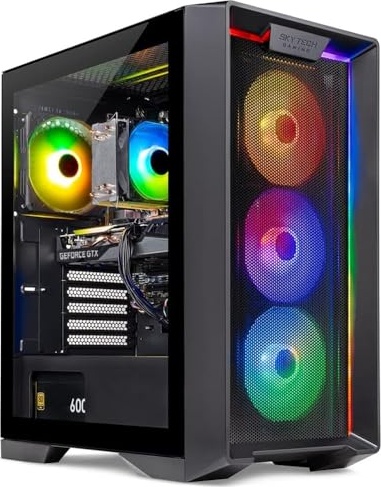
Skytech Chronos
$1,899.99
| GPU | Radeon RX 9070 XT |
| CPU | Ryzen 7 7700 |
| RAM | 32 GB |
+ View More Specs
Skytech Nebula
$599.99
| GPU | GeForce GTX 1650 |
| CPU | Core i3-10105F |
| RAM | 16 GB |
+ View More Specs
Dell Inspiron 3020 Tower
$579.00
| GPU | UHD Graphics 730 |
| CPU | Core i5-13400 |
| RAM | 16 GB |
+ View More Specs
Skytech Azure
$1,299.99
| GPU | GeForce RTX 4060 |
| CPU | Ryzen 7 9700X |
| RAM | 16 GB |
+ View More Specs
AEXPXO
$919.99
| GPU | GeForce RTX 4060 |
| CPU | Ryzen 7 5700X |
| RAM | 32 GB |
+ View More Specs
Skytech King 95
$2,599.98
| GPU | GeForce RTX 5070 Ti |
| CPU | Ryzen 7 9800X3D |
| RAM | 32 GB |
+ View More Specs
Skytech Archangel
$1,059.99
| GPU | GeForce RTX 4060 |
| CPU | Core i5-13400F |
| RAM | 32 GB |
+ View More Specs
Skytech Rampage
$2,399.98
| GPU | GeForce RTX 5070 Ti |
| CPU | Ryzen 7 9700X |
| RAM | 32 GB |
+ View More Specs
Gaming
$1,599.99
| GPU | GeForce RTX 4070 |
| CPU | Core i7-14700KF |
| RAM | 12 GB |
+ View More Specs
Skytech Azure
$1,499.99
| GPU | GeForce RTX 4060 |
| CPU | Ryzen 7 9700X |
| RAM | 32 GB |
+ View More Specs
Skytech King 95
$2,099.98
| GPU | Radeon RX 9070 XT |
| CPU | Ryzen 7 7800X3D |
| RAM | 32 GB |
+ View More Specs
Skytech
$1,699.99
| GPU | GeForce RTX 4070 Ti |
| CPU | Core i7-12700F |
| RAM | 16 GB |
+ View More Specs