CyberPowerPC Gamer Xtreme VR
Apr 29th, 2025
| GPU | GeForce RTX 5060 Ti 16 GB |
| CPU | Core i7-14700F |
| RAM | 16 GB |
+ View More Specs
Search and filter for PC builds. Click on a PC to view full specifications, and calculate the game's FPS performance. Compare PCs in games.
Add a PC Build
Click to Select a PC Build
Add a PC Build
Click to Select a PC Build
Found 18 PCs
CyberPowerPC Gamer Xtreme VR
Apr 29th, 2025
| GPU | GeForce RTX 5060 Ti 16 GB |
| CPU | Core i7-14700F |
| RAM | 16 GB |
+ View More Specs
iBUYPOWER Y40 PRO Black
Jan 31st, 2025
| GPU | GeForce RTX 5070 Ti |
| CPU | Ryzen 9 7900X |
| RAM | 32 GB |
+ View More Specs
CyberPowerPC Gamer Master
Apr 29th, 2025
| GPU | GeForce RTX 5060 Ti |
| CPU | Ryzen 7 8700F |
| RAM | 16 GB |
+ View More Specs
CyberPowerPC Gamer Xtreme VR
Apr 29th, 2025
| GPU | GeForce RTX 5070 |
| CPU | Core i9-14900KF |
| RAM | 32 GB |
+ View More Specs
Panorama XL
–
| GPU | GeForce RTX 5080 |
| CPU | Core i9-14900KF |
| RAM | 96 GB |
+ View More Specs
CYBERPOWERPC Gamer Master
Aug 1st, 2023
| GPU | GeForce RTX 4060 |
| CPU | Ryzen 5 7600 |
| RAM | 16 GB |
+ View More Specs
Skytech Azure 3
Dec 12th, 2024
| GPU | GeForce RTX 4060 |
| CPU | Ryzen 7 9700X |
| RAM | 16 GB |
+ View More Specs
Alienware Aurora
Jan 9th, 2025
| GPU | GeForce RTX 5070 |
| CPU | Core Ultra 7 265F |
| RAM | 32 GB |
+ View More Specs
Skytech King 95
Mar 6th, 2025
| GPU | Radeon RX 9070 XT |
| CPU | Ryzen 7 7800X3D |
| RAM | 32 GB |
+ View More Specs
Skytech Azure 3
Jun 3rd, 2025
| GPU | GeForce RTX 5060 |
| CPU | Ryzen 7 9700X |
| RAM | 16 GB |
+ View More Specs
Skytech King 95
Feb 21st, 2025
| GPU | GeForce RTX 5070 Ti |
| CPU | Ryzen 7 9800X3D |
| RAM | 32 GB |
+ View More Specs
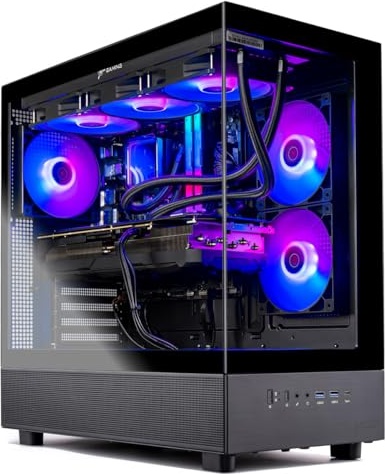
iBUYPOWER Slate MESH
Mar 5th, 2025
| GPU | GeForce RTX 5070 |
| CPU | Core i7-14700F |
| RAM | 32 GB |
+ View More Specs
Panorama XL RTX 5090
–
| GPU | GeForce RTX 5090 |
| CPU | Ryzen 9 9950X3D |
| RAM | 192 GB |
+ View More Specs
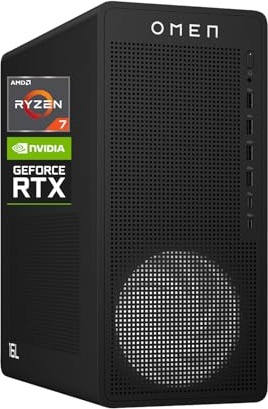
HP OMEN 16L Pro Business
–
| GPU | GeForce RTX 5060 |
| CPU | Ryzen 7 8700F |
| RAM | 64 GB |
+ View More Specs
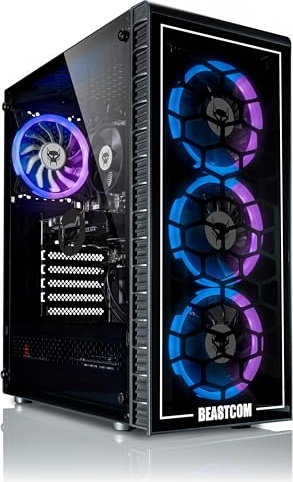
BEASTCOM Q5 Pro
–
| GPU | GeForce RTX 5060 |
| CPU | Ryzen 7 8700F |
| RAM | 32 GB |
+ View More Specs
Skytech Azure
May 19th, 2025
| GPU | GeForce RTX 5060 |
| CPU | Ryzen 7 5700 |
| RAM | 32 GB |
+ View More Specs
Skytech Archangel
Jun 25th, 2024
| GPU | GeForce RTX 4060 |
| CPU | Core i5-13400F |
| RAM | 32 GB |
+ View More Specs
Skytech Chronos 3
Mar 6th, 2025
| GPU | Radeon RX 9070 XT |
| CPU | Ryzen 7 7700 |
| RAM | 32 GB |
+ View More Specs