TOP 1 PC for$5,000
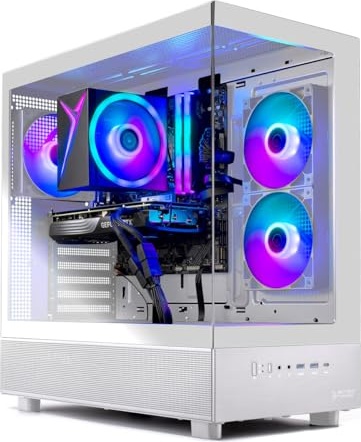
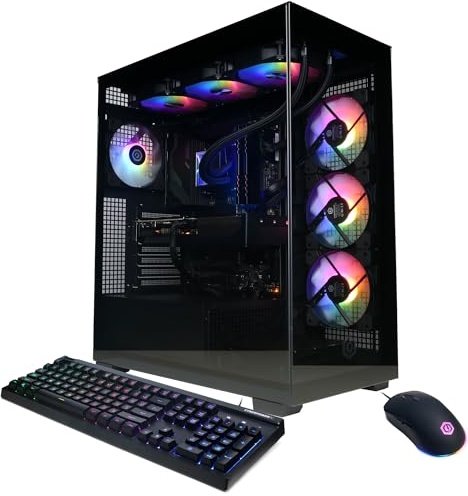
Skytech Legacy 4 Gaming, RTX 5090, Ryzen 9 9950X3D, 64 GB DDR5, 4 TB PCIe NVMe M.2 SSD
Sep 17th, 2025
FPS
| RTX 5090#1 | |
| Ryzen 9 9950X3D#1 | |
| 64 GB |
+ View More Specs


Search and filter for PC builds. Click on a PC to view stock, specifications, and calculate the game's FPS performance. Compare PCs in games.
By price segment – the best prebuilt gaming PCs your money can buy in 2025
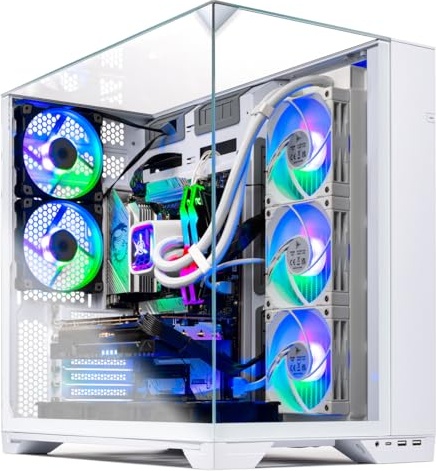
TOP 1 PC for$5,000
Skytech Legacy 4 Gaming, RTX 5090, Ryzen 9 9950X3D, 64 GB DDR5, 4 TB PCIe NVMe M.2 SSD
Sep 17th, 2025
FPS
| RTX 5090#1 | |
| Ryzen 9 9950X3D#1 | |
| 64 GB |
+ View More Specs
TOP 1 PC for$4,250
FPS
| RTX 5090#1 | |
| Ryzen 7 9800X3D#3 | |
| 32 GB |
+ View More Specs
TOP 1 PC for$4,000
FPS
| RTX 5090#1 | |
| Ryzen 7 9700X#10 | |
| 32 GB |
+ View More Specs
TOP 1 PC for$3,750
FPS
| RTX 5090#1 | |
| Ultra 9 285K#9 | |
| 64 GB |
+ View More Specs
TOP 1 PC for$3,500
FPS
| RTX 5080#3 | |
| Ryzen 9 9900X3D#2 | |
| 32 GB |
+ View More Specs
TOP 1 PC for$3,250
FPS
| RTX 5080#3 | |
| Ryzen 9 9900X#8 | |
| 64 GB |
+ View More Specs
TOP 1 PC for$3,000
FPS
| RTX 5080#3 | |
| Ultra 9 285#16 | |
| 32 GB |
+ View More Specs
TOP 1 PC for$2,750
FPS
| RTX 5080#3 | |
| Ultra 7 265K#14 | |
| 32 GB |
+ View More Specs
TOP 1 PC for$2,500
FPS
| RTX 5070 Ti#8 | |
| Ryzen 9 7900X#28 | |
| 32 GB |
+ View More Specs
TOP 1 PC for$2,250
FPS
| RTX 5070#13 | |
| Ultra 7 265KF#17 | |
| 32 GB |
+ View More Specs
TOP 1 PC for$2,000
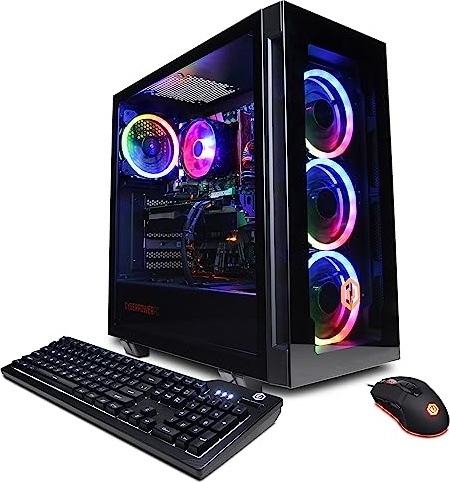
CyberPowerPC Gamer Xtreme VR, RTX 5070, i9-14900KF, 32 GB DDR5, 2 TB PCIe NVMe M.2 SSD
Apr 29th, 2025
FPS
| RTX 5070#13 | |
| i9-14900KF#18 | |
| 32 GB |
+ View More Specs
TOP 1 PC for$1,750
FPS
| RTX 4060 Ti 8 GB#41 | |
| i7-14700F#44 | |
| 32 GB |
+ View More Specs
TOP 1 PC for$1,500
FPS
| RTX 5060 Ti#33 | |
| Ultra 7 265KF#17 | |
| 16 GB |
+ View More Specs
TOP 1 PC for$1,250
FPS
| RTX 5060 Ti#33 | |
| Ryzen 7 8700F#64 | |
| 16 GB |
+ View More Specs
TOP 1 PC for$1,000
CyberPowerPC Gamer Master, RTX 4060, Ryzen 5 7600, 16 GB DDR5, 500 GB PCIe NVMe M.2 SSD
Aug 1st, 2023
FPS
| RTX 4060#57 | |
| Ryzen 5 7600#58 | |
| 16 GB |
+ View More Specs
Found 694 PCs
TOP 1 PC for$1,250
FPS
| RTX 5060 Ti#33 | |
| Ryzen 7 8700F#64 | |
| 16 GB |
+ View More Specs
TOP 1 PC for$3,000
FPS
| RTX 5080#3 | |
| Ultra 9 285#16 | |
| 32 GB |
+ View More Specs
TOP 1 PC for$2,250
FPS
| RTX 5070#13 | |
| Ultra 7 265KF#17 | |
| 32 GB |
+ View More Specs
TOP 1 PC for$1,500
FPS
| RTX 5060 Ti#33 | |
| Ultra 7 265KF#17 | |
| 16 GB |
+ View More Specs
TOP 1 PC for$2,000
CyberPowerPC Gamer Xtreme VR, RTX 5070, i9-14900KF, 32 GB DDR5, 2 TB PCIe NVMe M.2 SSD
Apr 29th, 2025
FPS
| RTX 5070#13 | |
| i9-14900KF#18 | |
| 32 GB |
+ View More Specs
TOP 2 PC for$1,500
FPS
| RTX 5060 Ti 16 GB#32 | |
| i7-14700F#44 | |
| 16 GB |
+ View More Specs
TOP 2 PC for$1,250
FPS
| RTX 5060#37 | |
| i7-14700F#44 | |
| 16 GB |
+ View More Specs

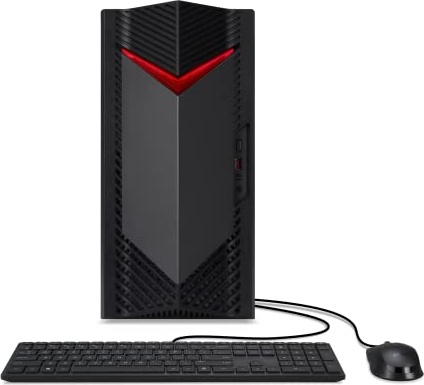
acer Nitro 60 N60-640-UR26, RTX 5060 Ti, i7-14700F, 32 GB DDR5, 2 TB PCIe NVMe M.2 SSD
Jun 30th, 2025
FPS
| RTX 5060 Ti#33 | |
| i7-14700F#44 | |
| 32 GB |
+ View More Specs
TOP 3 PC for$1,500
FPS
| RTX 4060#57 | |
| i7-14700F#44 | |
| 16 GB |
+ View More Specs
FPS
| RTX 5060 Ti#33 | |
| i7-14700F#44 | |
| 16 GB |
+ View More Specs
TOP 2 PC for$2,000
FPS
| RTX 5070#13 | |
| i7-14700F#44 | |
| 32 GB |
+ View More Specs
FPS
| RTX 5060#37 | |
| i5-14400F#86 | |
| 32 GB |
+ View More Specs
TOP 1 PC for$2,500
FPS
| RTX 5070 Ti#8 | |
| Ryzen 9 7900X#28 | |
| 32 GB |
+ View More Specs
TOP 1 PC for$1,750
FPS
| RTX 4060 Ti 8 GB#41 | |
| i7-14700F#44 | |
| 32 GB |
+ View More Specs
FPS
| RTX 5060#37 | |
| i5-14400F#86 | |
| 16 GB |
+ View More Specs
FPS
| RTX 5060 Ti#33 | |
| Ultra 7 265#27 | |
| 32 GB |
+ View More Specs
FPS
| RTX 5050#58 | |
| i5-14400F#86 | |
| 16 GB |
+ View More Specs
FPS
| RTX 5050#58 | |
| i5-14400F#86 | |
| 32 GB |
+ View More Specs